
Home > Apps > Video Players & Editors > Sound Analyzer Basic

| App Name | Sound Analyzer Basic |
| Category | Video Players & Editors |
| Size | 3.00M |
| Latest Version | v1.13.0 |
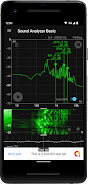
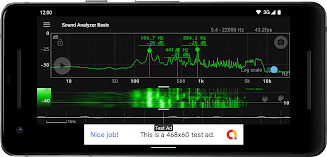


Sound Analyzer Basic is a mobile application designed for real-time analysis of audio signals. It provides a comprehensive view of audio data by displaying frequency (Hz) and amplitude (dB) spectra, spectral changes over time (waterfall view), and sound waveforms simultaneously. The app boasts high frequency measurement accuracy, with a measurement error typically within 0.1Hz in low-noise environments.
Key features of Sound Analyzer Basic include:
- Peak frequency display: Identifies and displays the dominant frequencies present in the audio signal.
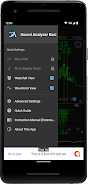
- Touch-based display range control: Allows users to easily adjust the displayed frequency range for focused analysis.
- Switchable frequency axis scale: Offers both logarithmic and linear scales for the frequency axis, providing flexibility in data visualization.
- Waterfall view: Visualizes spectral changes over time, enabling users to track the evolution of the audio signal.
- Waveform view: Displays the sound waveform, offering a complementary perspective on the audio signal.
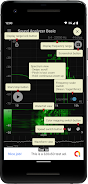
- Screenshot function: Captures images of the displayed data for easy sharing or documentation.
The app supports a high frequency range setting of up to 96kHz. However, it's important to note that frequencies exceeding 22.05kHz may be filtered out by most devices, potentially resulting in weak noise in that range. Additionally, certain frequencies like 48kHz and 96kHz might exhibit increased noise due to filter processing in some device models.
Here are six advantages of using the Sound Analyzer Basic app:
- Real-time frequency and amplitude display: Provides immediate analysis of audio signals by displaying frequency and amplitude spectra in real-time.
- Spectral changes over time: Enables users to monitor how the audio signal evolves by displaying changes in spectra over time.
- Waveform visualization: Offers a comprehensive view of the audio signal by displaying sound waveforms alongside spectral analysis.
- High measurement accuracy: Delivers highly accurate frequency measurements, with errors typically within -1Hz in low-noise environments.
- Customizable display range: Allows users to easily adjust the display range through touch operation, enabling focused analysis of specific frequency ranges.
- Optional frequency axis scale: Provides flexibility in data visualization by offering the option to switch between logarithmic and linear scales for the frequency axis.
-
 Sonic Racing: CrossWorlds Characters and Tracks Revealed for Upcoming Closed Network Test
-
 Marvel Rivals Season 1 Release Date Revealed
-
 Honkai: Star Rail Update Unveils Penacony Conclusion
-
 Announcing Path of Exile 2: Guide to Sisters of Garukhan Expansion
-
 Ubisoft Cancels Assassin's Creed Shadows Early Access
-
 Best Model Kits for Adults in 2025: Ultimate Guide